Executive Summary
This report presents a comprehensive exploratory analysis of the Alberta Energy Regulator's Statistical Series 39: Alberta Mineable Oil Sands Plant Statistics spanning 2020-2024. Through systematic examination of production metrics, operational efficiency indicators, and inter-facility performance comparisons, this analysis identifies key operational trends, develops strategic questions for business planning, and establishes a foundation for predictive modeling and capital allocation decisions relevant to upstream oil sands finance and business performance advisory.
Business Context
- Alberta's mineable oil sands represent ~60% of Canada's crude oil production capacity
- 8 major mining operations across 5 operators drive industry output
- Integrated upgraders (Suncor, Syncrude, CNRL Horizon) compete with bitumen-only producers
- Energy costs and recovery efficiency are key competitive differentiators
- Understanding operational patterns informs investment and benchmarking decisions
Analysis Objectives
- Quantify production trends and growth patterns across operators
- Benchmark operational efficiency metrics (recovery rates, energy intensity)
- Identify seasonal patterns and production volatility factors
- Analyze competitive positioning and market share dynamics
- Translate operational metrics to financial statement implications
Industry Snapshot (2020-2024)
Production Performance Analysis
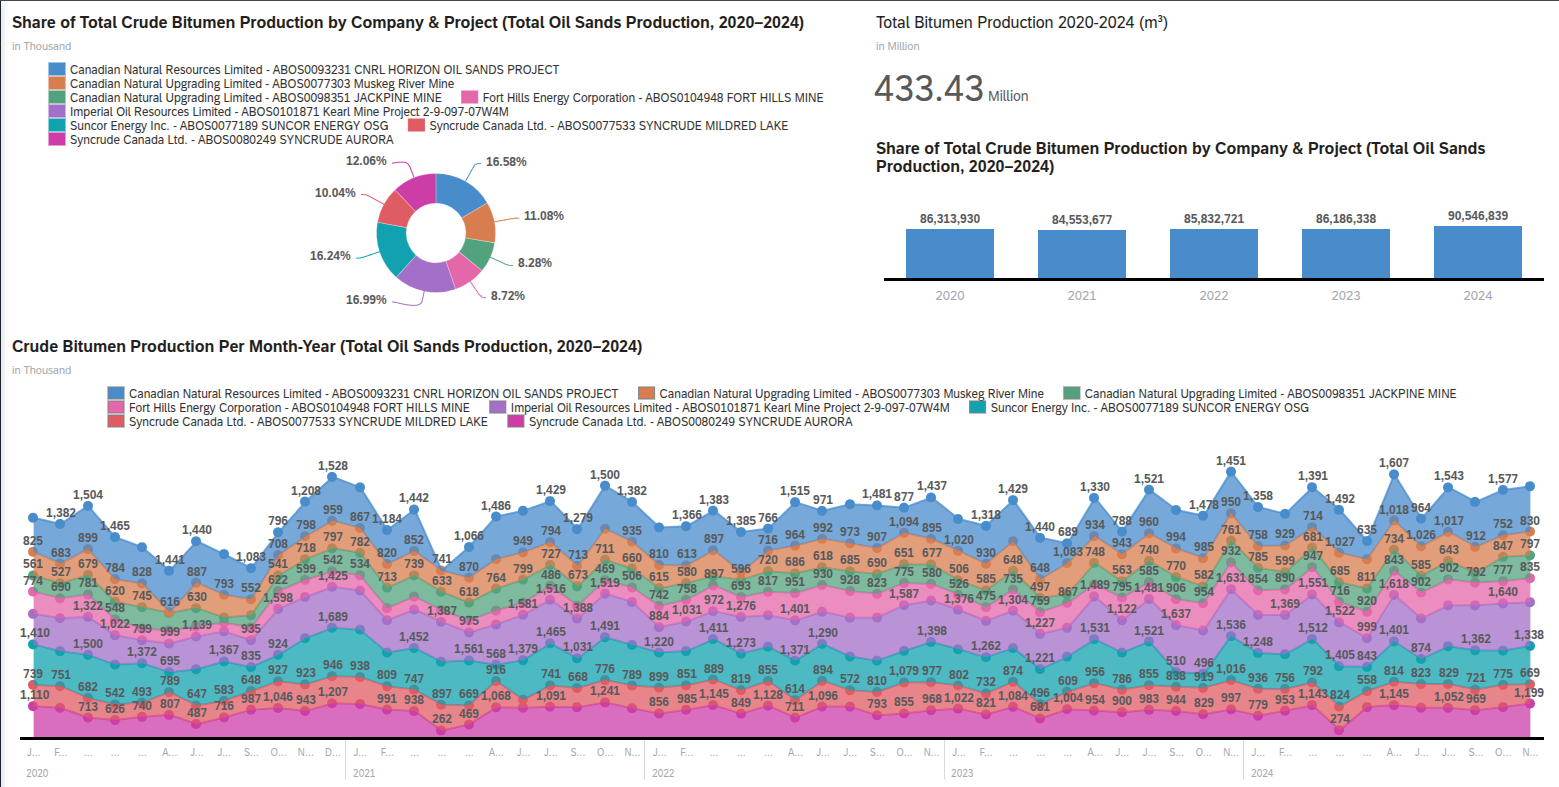
Annual bitumen production across all major operators totaled 433.43 million m³ over the 2020-2024 period. Despite COVID-19 disruptions causing a production dip in 2021 (84.6M m³), the industry demonstrated resilience with a strong recovery to 90.5M m³ in 2024—representing a 5.1% year-over-year increase and a 1.2% compound annual growth rate over the period.
Annual Bitumen Production Trend
| Year | Production (M m³) | YoY Change | Cumulative Total (M m³) |
|---|---|---|---|
| 2020 | 86.31 | — | 86.31 |
| 2021 | 84.55 | -2.0% | 170.87 |
| 2022 | 85.83 | +1.5% | 256.70 |
| 2023 | 86.19 | +0.4% | 342.89 |
| 2024 | 90.55 | +5.1% | 433.43 |
Market Share by Operator (2020-2024 Total)
| Operator / Project | Market Share | Operator Type |
|---|---|---|
| Imperial Kearl Mine | 16.99% | Bitumen Producer |
| CNRL Horizon Oil Sands | 16.58% | Integrated |
| Suncor Energy OSG | 16.24% | Integrated |
| Syncrude Aurora | 12.06% | Integrated |
| CNUL Muskeg River Mine | 11.08% | Bitumen Producer |
| Syncrude Mildred Lake | 10.04% | Integrated |
| Fort Hills Mine | 8.72% | Bitumen Producer |
| CNUL Jackpine Mine | 8.28% | Bitumen Producer |
Key Production Findings
📈 Strong 2024 Recovery
2024 marked the strongest production year in the period at 90.55M m³, representing 5.1% growth over 2023 and demonstrating the sector's operational resilience post-pandemic.
🏭 Imperial Kearl Mine Leads Market Share
Imperial Oil Kearl Mine leads with 16.99% market share, followed closely by CNRL Horizon (16.58%) and Suncor Energy OSG(16.24%).
⚖️ Balanced Competition
Top 3 operators hold about 50% market share, indicating a balanced competitive landscape. No single operator dominates, supporting competitive pricing dynamics.
Operational Efficiency Benchmarking
Operational efficiency varies significantly across operators, driven by ore quality, processing technology, and facility age. Understanding these efficiency metrics enables benchmarking and identification of operational improvement opportunities with direct implications for operating costs and profitability.
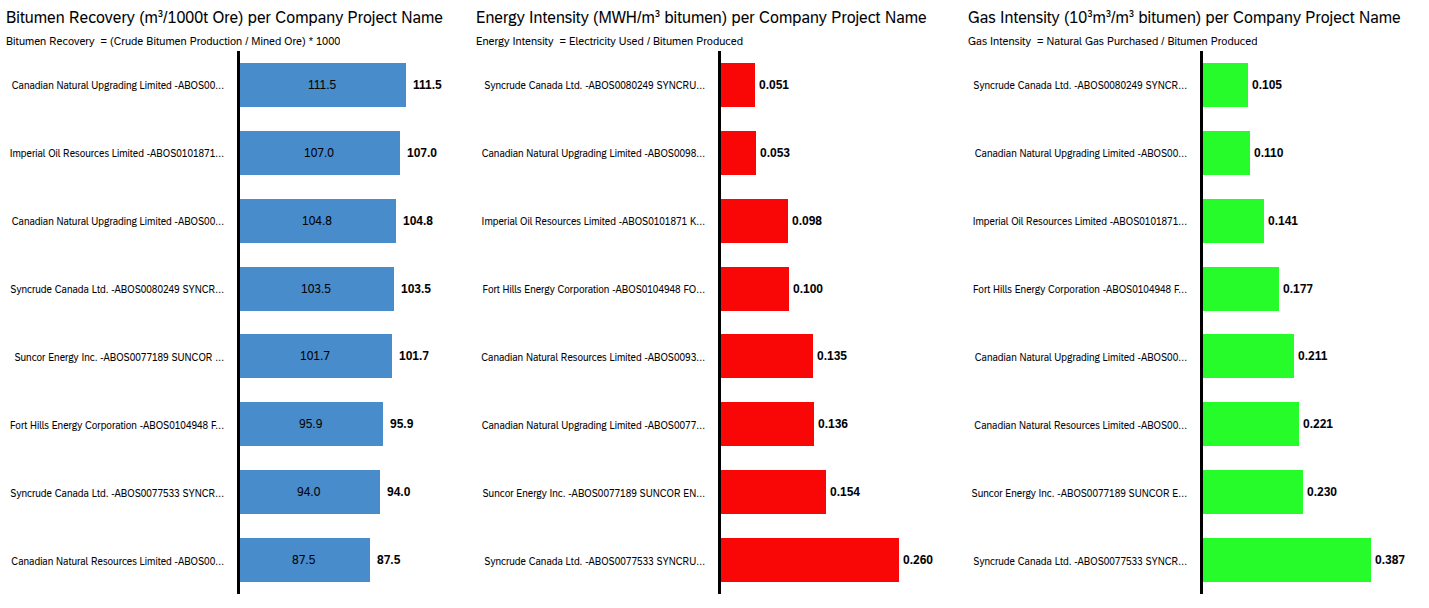
Efficiency Metrics Comparison (2020-2024 Average)
| Operator / Project | Bitumen Recovery (m³/1000t ore) |
Energy Intensity (MWh/m³ bitumen) |
Gas Intensity (10³m³/m³ bitumen) |
Efficiency Rank |
|---|---|---|---|---|
| CNUL Muskeg River | 111.5 | 0.136 | 0.211 | 🥇 1st |
| Imperial Kearl | 107.0 | 0.098 | 0.141 | 🥈 2nd |
| CNUL Jackpine | 104.8 | 0.053 | 0.110 | 🥉 3rd |
| Syncrude Aurora | 103.5 | 0.051 | 0.105 | 4th |
| Suncor Energy | 101.7 | 0.154 | 0.230 | 5th |
| Fort Hills | 95.9 | 0.100 | 0.177 | 6th |
| Syncrude Mildred Lake | 94.0 | 0.260 | 0.387 | 7th |
| CNRL Horizon | 87.5 | 0.135 | 0.221 | 8th |
Efficiency Analysis Insights
⛏️ Recovery Rate Variance: 27%
Bitumen recovery ranges from 87.5 to 111.5 m³ per 1000 tonnes ore mined, reflecting ore quality differences and extraction technology effectiveness across operations.
🔋 Energy Intensity Gap: 5.1x
Energy consumption varies 5.1x between most efficient (Syncrude Aurora: 0.051) and least efficient (Syncrude Mildred Lake: 0.260) operators, indicating significant optimization potential.
💰 Cost Implications
Energy efficiency leaders likely enjoy $2-5/bbl operating cost advantage, translating to $50-125M+ annual savings at scale based on typical production volumes.
Financial Statement Implications for FP&A
This section translates AER ST39 operational data into key financial drivers for forecasting and variance analysis. All calculations reference specific data sources so you can trace numbers and explain the analysis to leadership.
Data Sources
- AER ST39: Production (m³), energy use (MWh), gas use (10³m³), recovery rates
- Market Benchmarks: WCS/WTI pricing, power rates ($50/MWh), gas rates ($3/GJ)
- Company Reports: Suncor, CNRL, Imperial 2023 financials for cost benchmarks
- Conversion: 1 m³ bitumen = 6.29 barrels
FP&A Use Cases
- Budget vs. actual variance analysis for production and costs
- Operating cost forecasting by production scenario
- Benchmarking efficiency metrics against industry peers
- Sensitivity analysis for commodity prices and operating leverage
Revenue Drivers
📈 Production Volume Growth Impact
Operating Cost Analysis
💵 Energy Costs: Largest Variable OpEx Driver
⛏️ Recovery Rate Impact on Mining Costs
📊 Total Operating Cost Benchmarks
Cash Flow Forecasting
💰 Operating Cash Flow Sensitivity
🏗️ Capital Expenditure Planning
Key FP&A Metrics
💵 Operating Netback ($/bbl)
Formula: WCS price - royalties - transport - OpEx. Example: $55 - $7 - $3 - $25 = $20/bbl. Range: $15-30/bbl based on efficiency (AER ST39 data). Use: Key driver for operating cash flow; variance analysis vs. budget.
💹 EBITDA Margin (%)
Formula: (Revenue - OpEx) ÷ Revenue. Efficient operator: ($55 - $25) ÷ $55 = 54.5%. Inefficient: ($55 - $35) ÷ $55 = 36.4%. Use: Profitability benchmarking; track quarterly trends vs. peers.
📊 Free Cash Flow (FCF)
Formula: Operating cash flow - CapEx. Efficiency impact: Energy ($191M) + recovery ($73M) = $264M FCF improvement potential for worst-to-best quartile move. Use: Dividend coverage, debt repayment capacity forecasts.
Summary: Data-to-Financial Statement Flow
| AER ST39 Metric | Financial Impact | Typical Variance | FP&A Application |
|---|---|---|---|
| Production Volume (m³) | Revenue = Volume × Price | +5.1% YoY = $1.51B revenue | Top-line forecasts, scenario planning |
| Energy Intensity (MWh/m³) | Electricity operating cost | $1.66/bbl variance = $60.6M/year | OpEx budgeting, efficiency benchmarking |
| Gas Intensity (10³m³/m³) | Natural gas operating cost | $3.58/bbl variance = $130.6M/year | OpEx budgeting, carbon cost modeling |
| Recovery Rate (m³/1000t) | Mining cost per barrel | $1.96/bbl variance = $71.5M/year | Mining OpEx forecasts, CapEx prioritization |
Strategic Implications & Business Planning Relevance
The analysis findings translate directly into business planning and financial advisory applications for upstream oil sands operations and investment decisions.
Operational Excellence Benchmarking
The 27% variance in bitumen recovery rates and 5.1x range in energy intensity provide clear benchmarking targets. Operators below median on efficiency metrics should prioritize technology upgrades and process optimization to remain competitive. CNUL Muskeg River's leading recovery rate (111.5) and Syncrude Aurora's energy efficiency (0.051 MWh/m³) establish best-in-class targets.
Production Forecasting Enhancement
The 2021 production dip (-2.0%) followed by strong 2024 recovery (+5.1%) demonstrates sector cyclicality that must be incorporated into financial models. Annual production variance provides inputs for revenue forecasting confidence intervals and scenario analysis.
Capital Allocation Decisions
The $2-5/bbl operating cost advantage of energy-efficient operations translates to $50-125M+ annual EBITDA improvement for a typical 100,000 bbl/day facility. Investment thesis should weight efficiency improvement potential alongside current performance when evaluating capital allocation.
Risk Assessment & Scenario Planning
Energy intensity trends inform carbon cost scenario analysis as regulatory frameworks evolve. With carbon pricing at $65/tonne CO2e (2023) rising to $170/tonne by 2030, gas intensity variance represents material future cost risk for high-consumption operators.
Methodology & Data Sources
Data Processing Pipeline
📥 Data Extraction
AER ST39 monthly reports (2020-2024) extracted from PDF format. 60 monthly reports consolidated into unified dataset covering 8 operators and 57,000+ data points.
🔄 Data Transformation
Power Query used for data cleaning and normalization. Calculated fields for recovery rates, energy intensity, growth rates, and market share percentages.
📈 Statistical Analysis
Excel used for descriptive statistics, trend analysis, and CAGR calculations. Correlation analysis for efficiency metric benchmarking.
Limitations & Considerations
- Public data only—no proprietary cost, price realization, or capital expenditure data available
- Monthly granularity limits ability to identify daily operational events
- Reporting variations across operators may impact comparability
- 5-year window may not capture full commodity price cycles
- Missing context: realized prices, turnaround schedules, capital projects during period
Questions or Want to Discuss?
I'm happy to discuss this analysis, upstream oil sands finance, or business planning & analytics methodology. Feel free to reach out or explore my other projects.
Disclaimer: This analysis uses publicly available data from the Alberta Energy Regulator's Statistical Series 39. All interpretations and insights are the author's own and do not represent the views of any company mentioned. This analysis is for educational and portfolio demonstration purposes only and should not be used for investment decisions.