Project Overview
In Oil and Gas operations, multiple companies often store product in shared plant tanks. When a plant consumes more product than delivered, it creates negative inventory positions for individual companies, causing cost accounting and financial reporting issues. The inventory control team's primary responsibility is to resolve these positions and implement processes to mitigate inventory risk—the potential for losses and inefficiencies affecting scheduling and downstream departments.
The Challenge
- Multiple analysts independently exported SAP reports each month
- Manual copy-paste ETL processes in Excel were time-intensive
- Inconsistent report formats across team members
- 30 minutes per analyst spent on data extraction vs analysis
- Duplicate effort resulted in 8+ hours of wasted time monthly
- Delayed resolution timelines during critical month-end periods
The Solution
- Automated SAP data extraction using Power Automate scripts
- Centralized data storage in SharePoint
- Built unified Power BI data model as central tracking database
- Generated standardized reports distributed by legal entity
- Reduced process time from 30 min to 1 min per analyst
- Enabled focus on high-value analysis and resolution activities
Solution Architecture
The solution integrates multiple systems to create an end-to-end automated workflow, eliminating manual data handling and enabling real-time reporting capabilities.
Data Flow Architecture
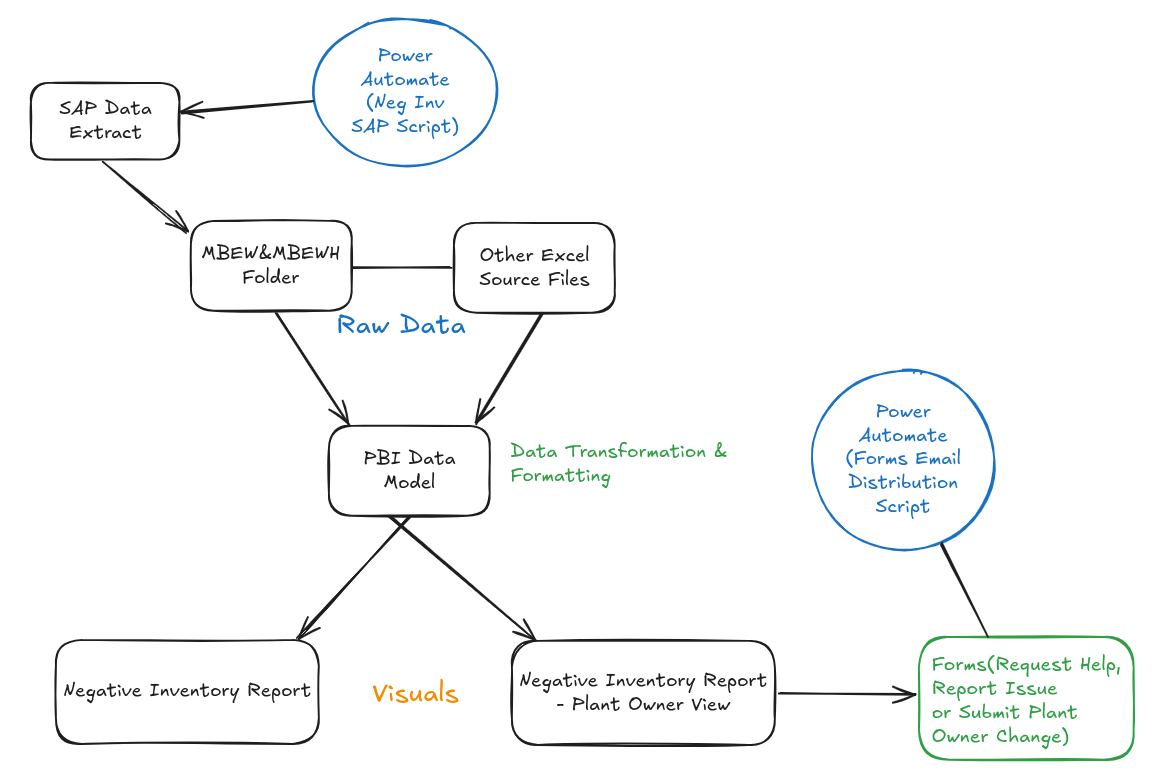
System architecture showing data flow from SAP extraction through Power BI visualization and automated distribution
Data Extraction & Automation
Implemented Power Automate scripts to extract negative inventory data from SAP on a scheduled basis. The automation queries multiple SAP tables including material master data, plant inventory positions, and ownership records. Data is extracted in a standardized format and automatically saved to a designated SharePoint folder, eliminating manual exports.
Centralized Data Storage
Configured SharePoint as the central repository for all extracted data and supporting Excel source files. This approach provides version control, accessibility for all team members, and serves as the single source of truth. The folder structure mirrors the data organization, making it intuitive for analysts to locate specific datasets.
Power BI Data Model Development
Built a comprehensive Power BI data model connecting SAP extracts and Excel source files. Created relationships between dimension tables (plants, materials, legal entities) and fact tables (inventory positions, historical trends). Implemented DAX measures for calculations including total negative inventory values, item counts, and deadline tracking.
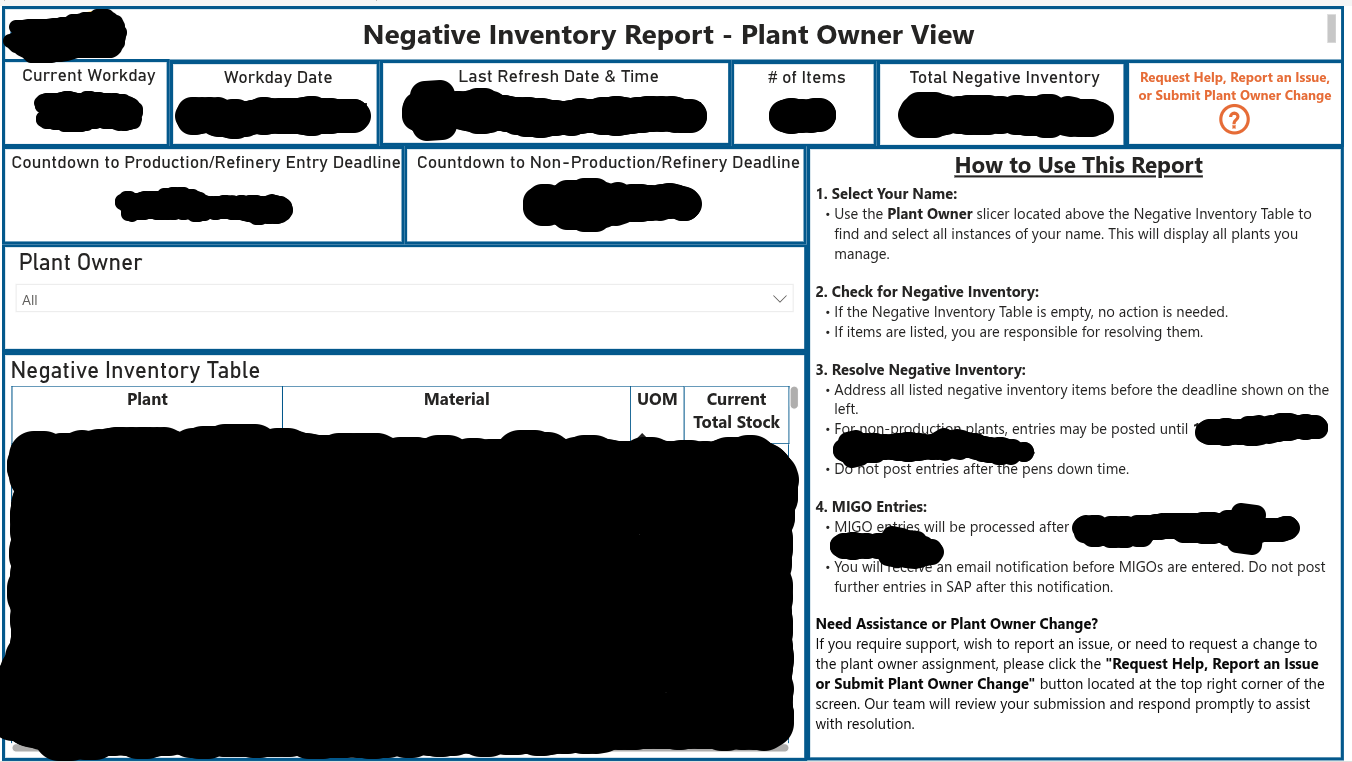
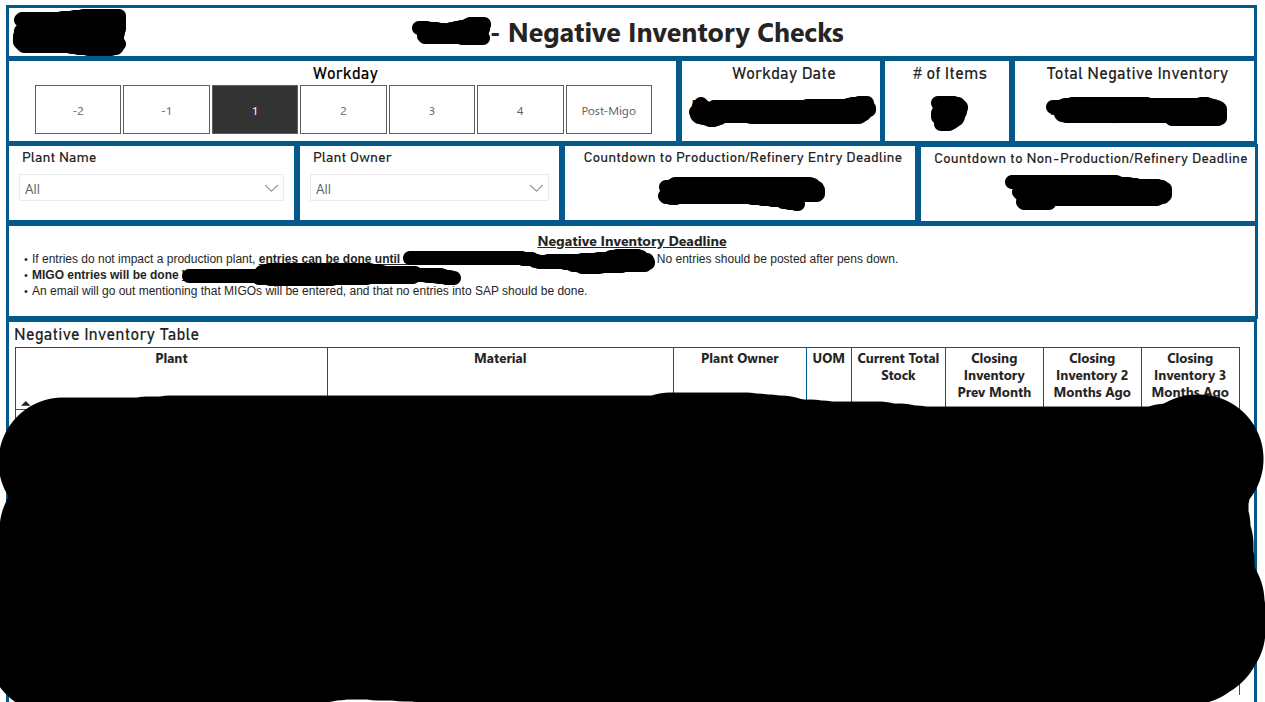
Interactive Dashboard & Reporting
Designed interactive dashboards with two primary views: a Plant Owner View for external stakeholders to monitor their negative inventory positions, and an Internal Checks view for inventory control analysts to track resolution progress. Implemented drill-down capabilities by plant, material, and workday for detailed analysis. Added an integrated help request form that automatically routes submissions to the appropriate inventory control analyst based on legal entity using Power Automate, ensuring timely response and accountability.
Data Model & Integration
The Power BI data model serves as the central tracking database, integrating multiple data sources and enabling comprehensive analysis of negative inventory positions across all plants and legal entities.
Power BI Data Model Schema

Click image to view full size | Comprehensive data model showing relationships between SAP extracts, dimension tables, and fact tables for negative inventory tracking
Key Data Sources
📊 SAP Data
Direct connection to SAP tables for real-time inventory positions, material master data, and plant ownership information. Automated extraction eliminates manual exports.
📁 Excel Source Files
Integration with supporting Excel files stored in SharePoint including cost centers, workday guides, and sorting tables for enhanced analysis capabilities.
🔄 Fact Tables
Consolidated fact tables tracking current negative inventory positions, historical closing inventory, and workday-specific snapshots for trend analysis.
🏷️ Dimension Tables
Dimension tables for plants, materials, legal entities, and time periods enabling flexible filtering and drill-down analysis across all business dimensions.
Dashboard Views & Functionality
The solution provides two complementary dashboard views: an external-facing Plant Owner View for stakeholder reporting and an internal Negative Inventory Checks view for team analysis and resolution tracking.
Key Features
⏰ Automated Deadline Tracking
Real-time countdown displays days remaining until production/refinery and non-production deadlines. Visual indicators help prioritize resolution efforts based on urgency and plant type.
🔍 Workday Navigation
Navigate through workdays (-2, -1, 1, 2, 3, 4, Post-MIGO) to track inventory positions across the month-end process. Compare current positions against historical data for pattern identification.
📧 Automated Distribution
Power Automate script distributes reports to plant owners by legal entity via email. Ensures timely communication and accountability for negative inventory resolution.
📈 Historical Trends
Track closing inventory positions from previous months to identify recurring issues. Supports root cause analysis and process improvement initiatives to prevent future occurrences.
Results & Business Impact
The automated negative inventory tracking solution transformed the inventory control team's month-end process, delivering significant time savings and enabling analysts to focus on value-added resolution activities rather than manual data compilation.
Quantitative Results
- Saved 8 hours of collective team time monthly by eliminating duplicate efforts
- Achieved 100% report consistency across all analysts and legal entities
- Eliminated manual errors in SAP data extraction and Excel pivot table creation
- Supported 3+ inventory control analysts with standardized reporting workflow
Qualitative Impact
- Inventory control analysts freed to focus on analyzing and resolving negative positions rather than compiling reports
- Improved visibility into recurring negative inventory patterns supports root cause analysis
- Standardized reporting format across legal entities improves stakeholder confidence
- Established foundation for additional automated inventory reporting initiatives
Key Learnings
Centralized Data Storage is Essential: SharePoint as the single source of truth eliminated version control issues and ensured all team members accessed consistent data. This proved critical for maintaining report accuracy across multiple analysts.
Automation Requires Initial Time Investment: Building the Power Automate scripts and Power BI data model required upfront effort, but the monthly time savings quickly justified the investment. Documenting the automation process ensured maintainability.
User Feedback Drives Continuous Improvement: Regular check-ins with inventory control analysts revealed opportunities for enhancement, such as adding workday navigation and historical trend tracking, making the dashboard more valuable for day-to-day operations.
Change Management Matters: Transitioning from manual Excel processes to automated Power BI reporting required training sessions and documentation. Creating a user guide with instructions on dashboard navigation and interpretation supported smooth adoption.
Questions or Want to Chat?
I'm always happy to discuss process improvements, automation projects, or just connect about data analytics work. Feel free to reach out or check out my other projects.
Disclaimer: This case study represents work completed as an employee of Suncor Energy. All data, screenshots, and metrics have been anonymized or recreated for demonstration purposes. No confidential or proprietary information is disclosed. The views and presentation are my own and do not necessarily represent those of Suncor Energy.